1.6 KiB
Visualizing training with TensorBoard
With the summary info generated, we can then use TensorBoard to visualize the behaviors of the BigDL program.
-
Installing TensorBoard
Prerequisites:
-
Python verison: 2.7, 3.4, 3.5, or 3.6
-
Pip version >= 9.0.1
To install TensorBoard using Python 2, you may run the command:
pip install tensorboard==1.0.0a4To install TensorBoard using Python 3, you may run the command:
pip3 install tensorboard==1.0.0a4Please refer to this page for possible issues when installing TensorBoard.
-
-
Launching TensorBoard
You can launch TensorBoard using the command below:
tensorboard --logdir=/tmp/bigdl_summariesAfter that, navigate to the TensorBoard dashboard using a browser. You can find the URL in the console output after TensorBoard is successfully launched; by default the URL is http://your_node:6006
-
Visualizations in TensorBoard
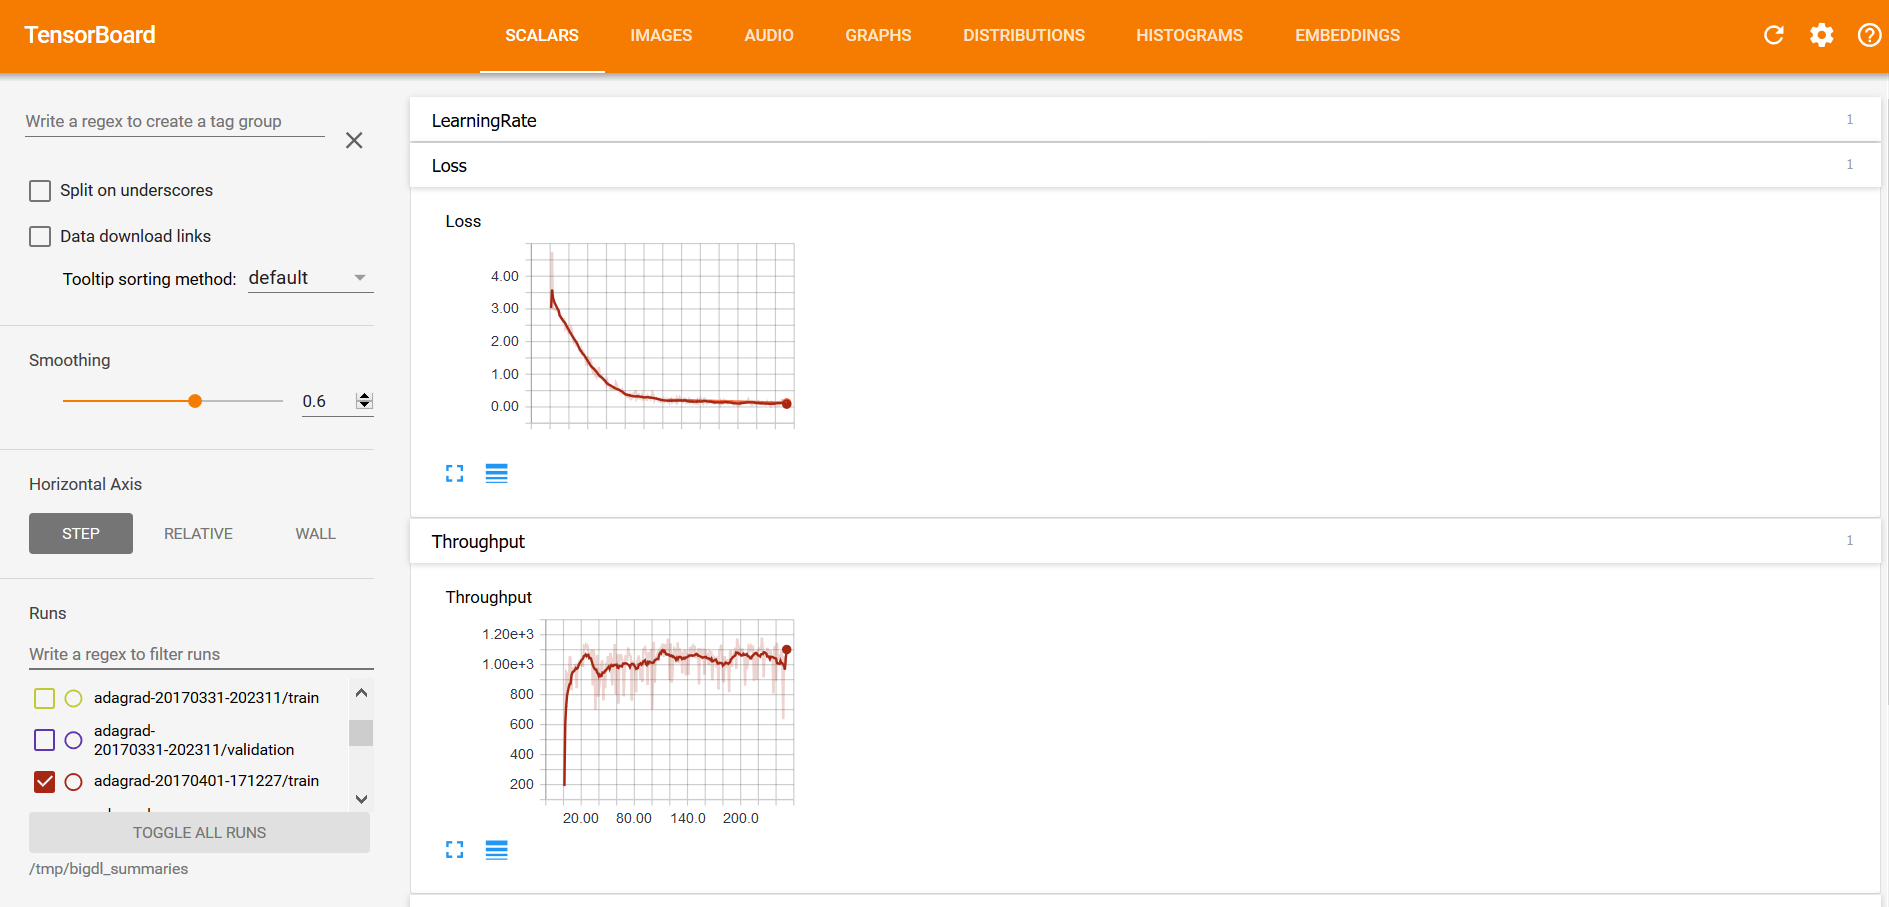
Within the TensorBoard dashboard, you will be able to read the visualizations of each run, including the “Loss” and “Throughput” curves under the SCALARS tab (as illustrated below):
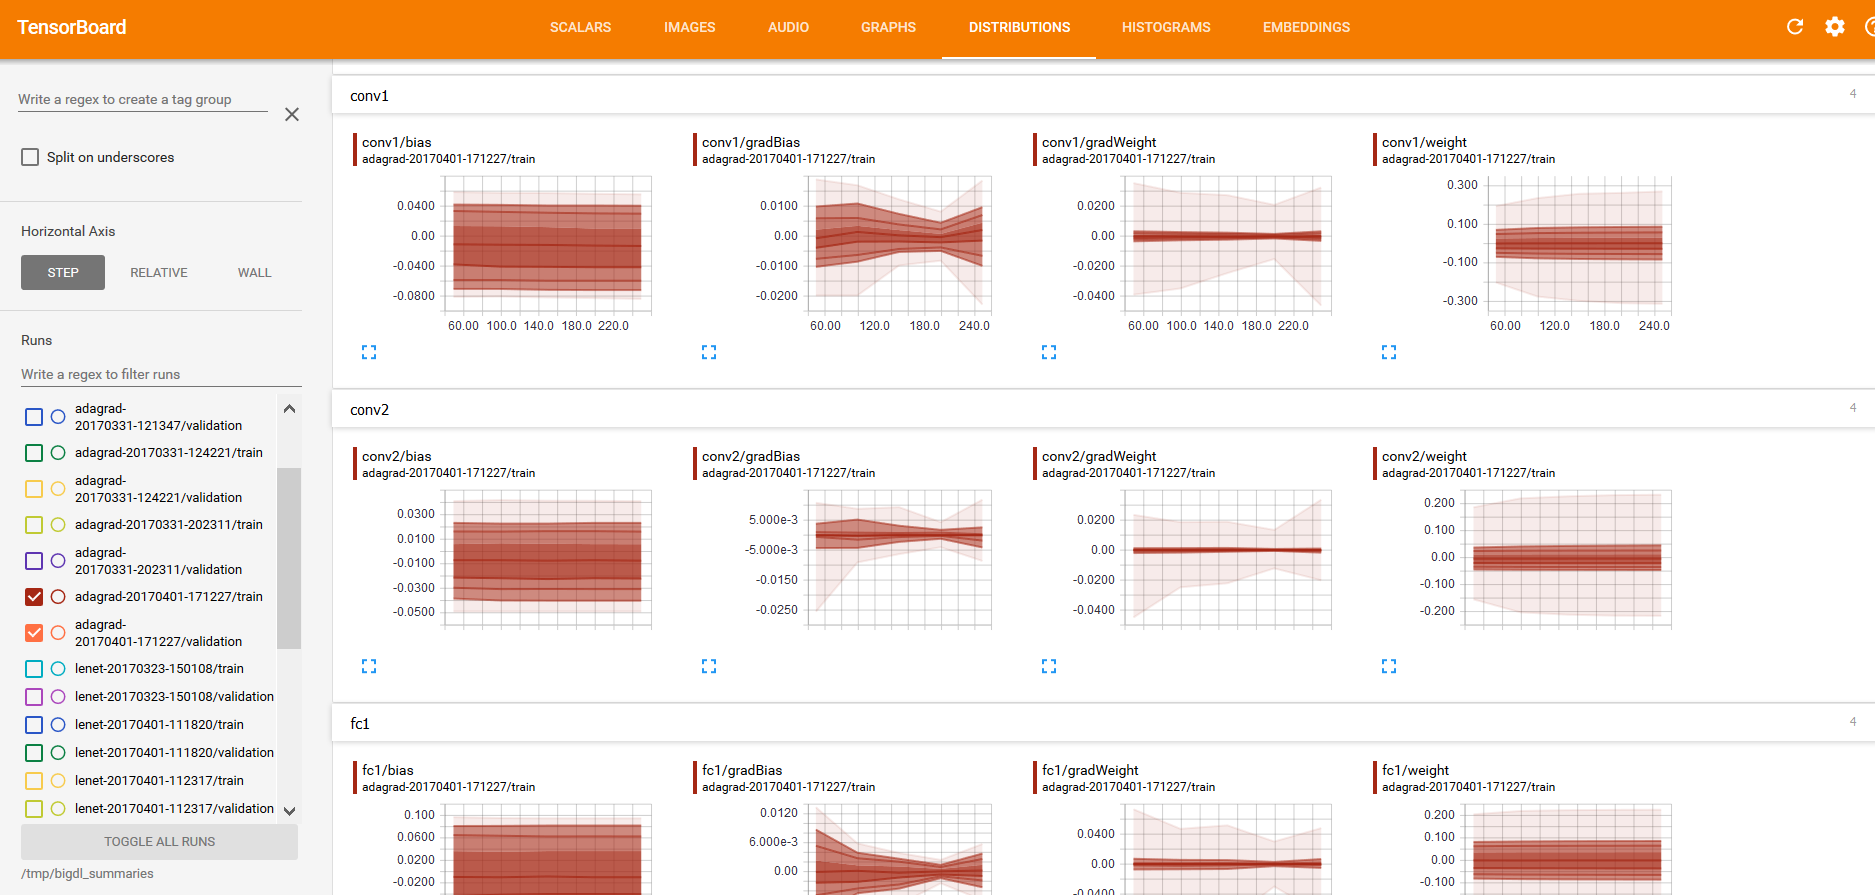
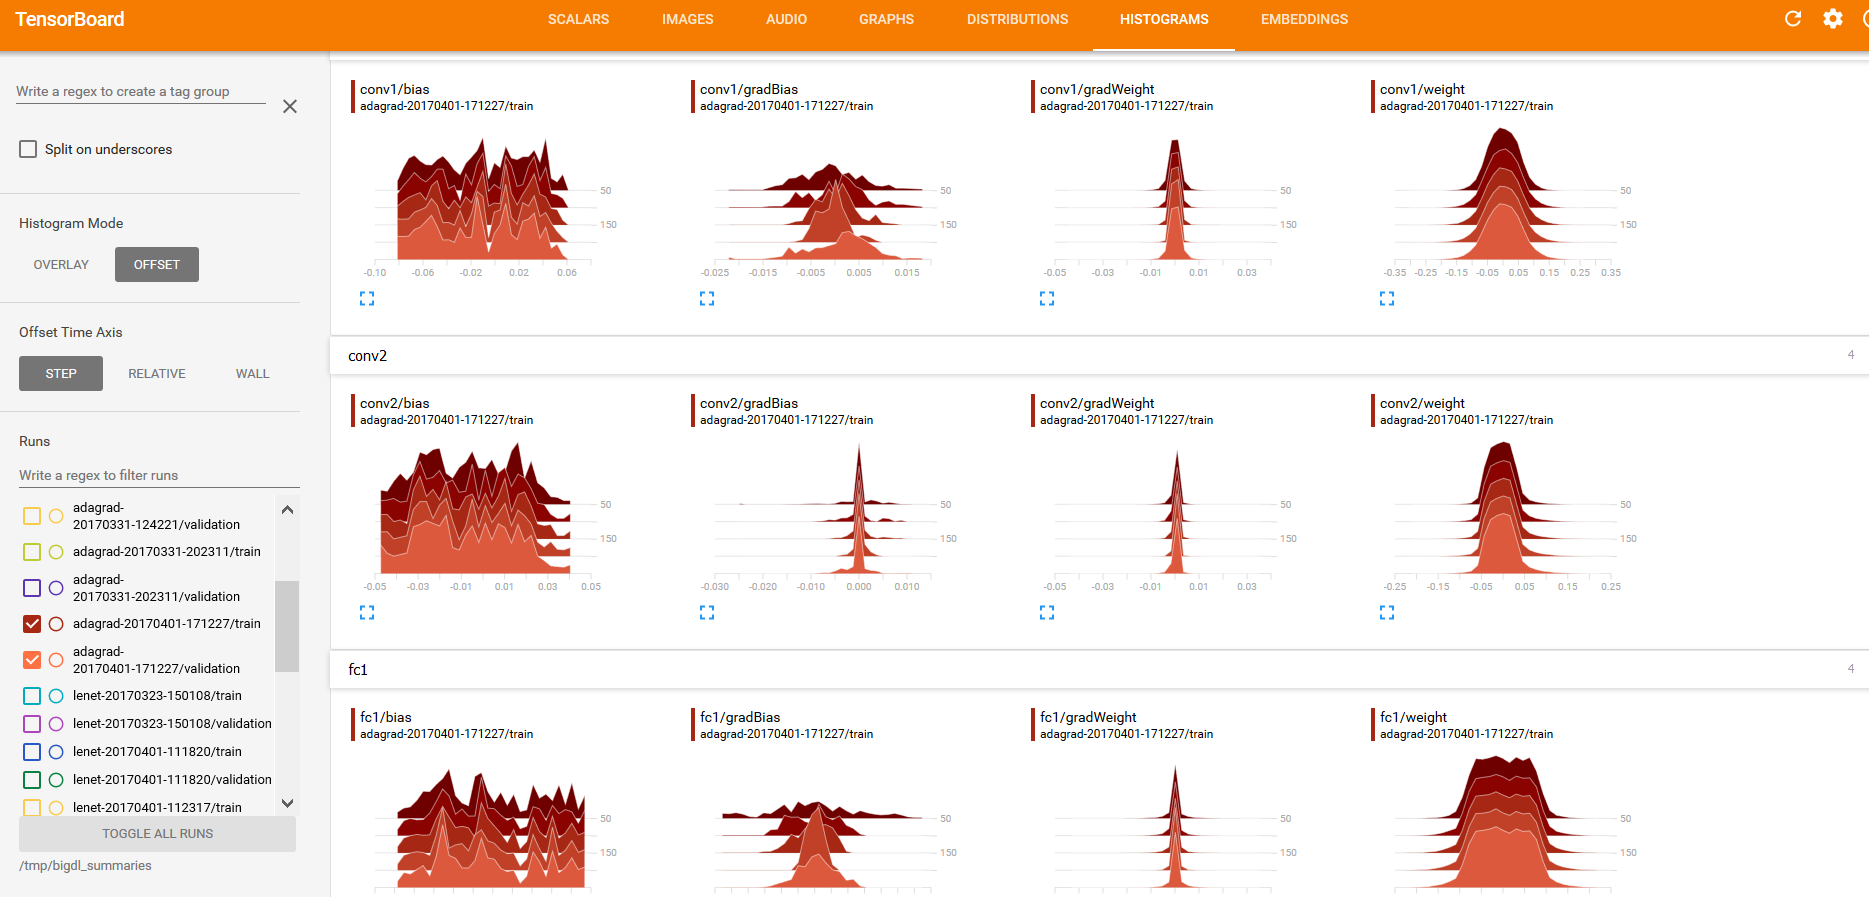
And “weights”, “bias”, “gradientWeights” and “gradientBias” under the DISTRIBUTIONS and HISTOGRAMS tabs (as illustrated below):